
The short answer
Google Analytics was made with behavior tracking in mind, providing insights on how users interact with your website or app. On the other hand, Google Search Console was built with Google Search in mind, offering site owners data regarding online visibility, organic reach, and technical optimization.
Google Analytics (GA) and Google Search Console (GSC) are completely different. They serve different data based on different purposes. GA was built with user behavior tracking in mind while GSC was built specifically to help site and app owners improve their SEO game.
These two platforms are independent of one another but they can do wonders when used together. That’s because a lot of the data provided by GSC complements the data shown in GA beautifully, giving you a complete picture of your users’ journey through your site and beyond.
Google Analytics vs Search Console: a quick comparison
Google Analytics is a complete analytics suite comprising thousands of metrics. It’s the ultimate hub for user behavior tracking and it can be configured in virtually infinite ways. GA can also be extremely confusing for new website owners, and for a good reason; the interface is cluttered with a ton of reports that you will probably never need.
On the other hand, Google Search Console is a bit more agile (yet confusing in ways which we will discuss in its own section).
» DOWNLOAD NOW: Buyer Persona Template for Your Small B2B Firm
This analytics platform was made specifically with Google Search in mind and its purpose is to provide organic search and technical data to improve your SEO and achieve better organic rankings on Google as a search engine.
Comparing these two monsters is a daunting task, but we can boil their features down to six key components covering 80-90% of the use cases:
| Google Analytics | Google Search Console |
|---|---|
| Audience Demographics | Organic Search Data |
| Acquisition Data (Referral Traffic) | URL Inspection & Live Tests |
| User Behavior | Website Enhancements |
| Conversion Tracking | Inbound & Outbound Links |
| Custom Reporting | Crawl & HTML Errors |
| Advanced Integrations | Malware Detection |
In the following sections, we’re going to analyze each feature of these two platforms, highlighting what they are used for and how you can benefit from them as a hobbyist, blogger, startup, or even established business owner.
Google Analytics
Google Analytics is the cream of the crop when it comes down to analytics platforms. Ever since it was released back in November 2005, this free tool has become the most used analytics platform on the planet, and it shows no sign of slowing down.
Look for yourself.
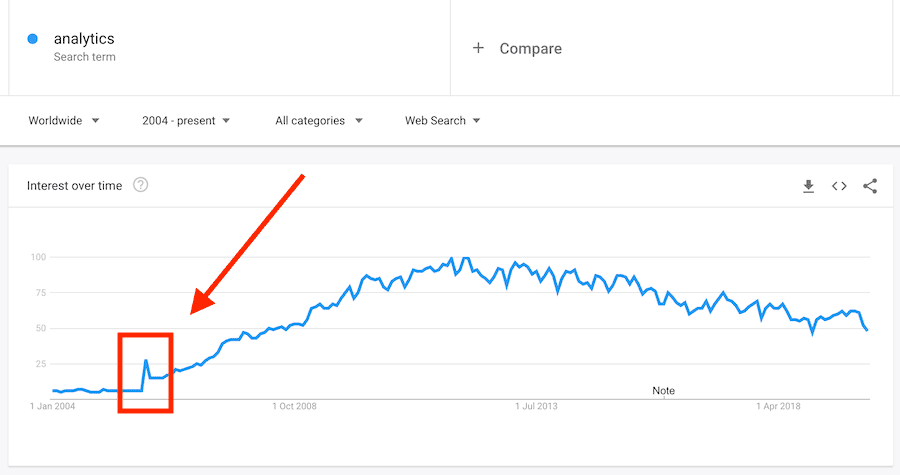
When GA first came out, the term “analytics” shot up in popularity.
This incredible tool can collect any kind of data related to your website or app. It’s the end-all, be-all of analytics software, and it comes jam-packed with features.
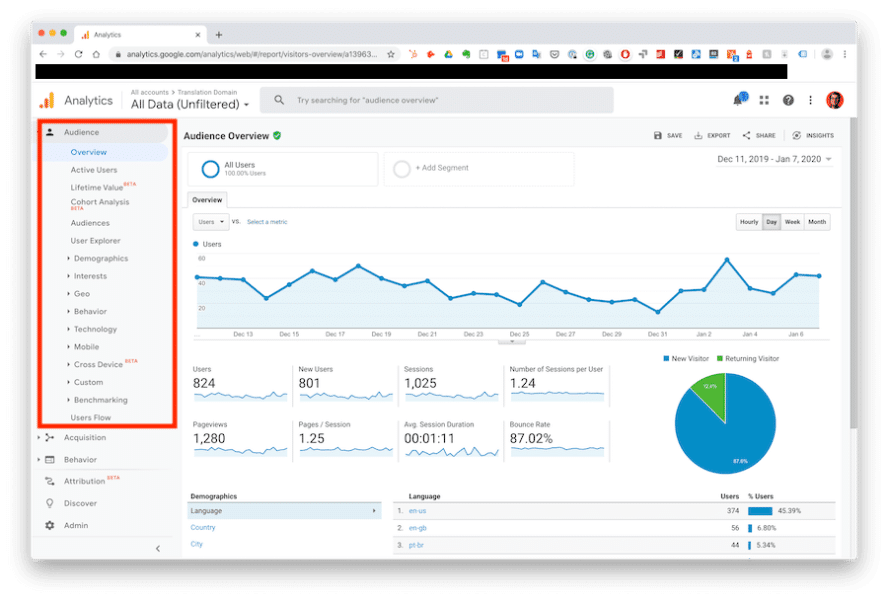
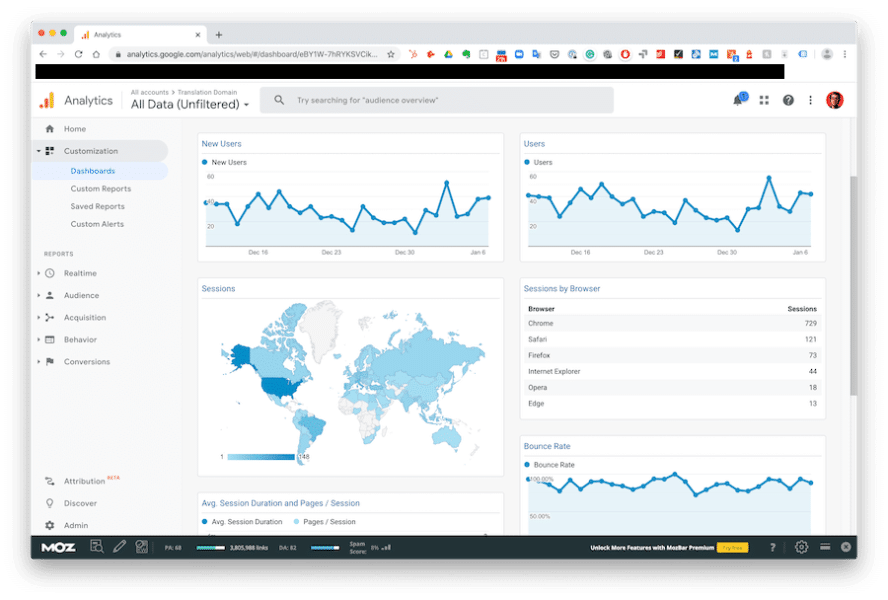
What you’re likely to see when you first log into any GA account is the famous Google Analytics Home dashboard, and it looks something like this (yours might look a little emptier if you’ve just signed up):
Analysts and marketers who are just starting out will have a general idea of what this does, but the home dashboard isn’t where you’ll spend most of your time. It’s a neat hub if you want to identify general trends, but you usually get much more value when you start digging.
One by one, let’s look at all the different reports in GA.
Audience Demographics
When you first start building traffic to your website—both referral and organic—there’s little way to understand where people are coming from, and what traits define them as potential leads or customers for your business, project, app etc.
That’s “quickly” solved by the audience reports in GA which show you pretty much everything you could think of: demographics and interests (only available if you’re signed up to Google Ads), geography, technology they use, device type, and even a handy benchmarking tool that shows you how your website is doing compared to other websites in your vertical.
Seriously, GA has it all.
This is why I say that it can be very confusing for startups and beginner marketers who haven’t had the opportunity to play around with data yet.
Look at this screenshot.
You have 16 options to choose from, 9 of which hide even more sub-options.
There are countless ways to make use of this data, but the way it should be set up depends on your business goals. If you don’t have a specific vision with your website or app, you won’t be able to use the data effectively as it only helps in driving decisions based on a pre-built framework.
At Koala Rank, we recommend that you define a purpose or an overarching analytics strategy for your app or website before you configure your analytics dashboard. This prevents irrelevant data from creeping in, and it also gives you a clear idea of what reports to use.
Side note: You should build the strategy specifically with analytics use in mind. We’re not talking about your business plan or branding guidelines; we’re talking about how your website interacts with GA properties, views, filters, goals, etc.
More reading on Google Analytics audience reports:
Acquisition Data (Referral Traffic)
This is another incredibly useful part of your GA interface, and it’s especially helpful when you’re running referral campaigns to drive traffic from other communities onto your website.
Fortunately, this menu area is much leaner compared to the audience reports. It’s meant to show where your traffic is coming from and compare that to different GA dimensions based on your business needs. That’s it.
For example, I recently posted something on Indie Hackers that gained traction and sent 82 users over to my site. Google Analytics shows me that.
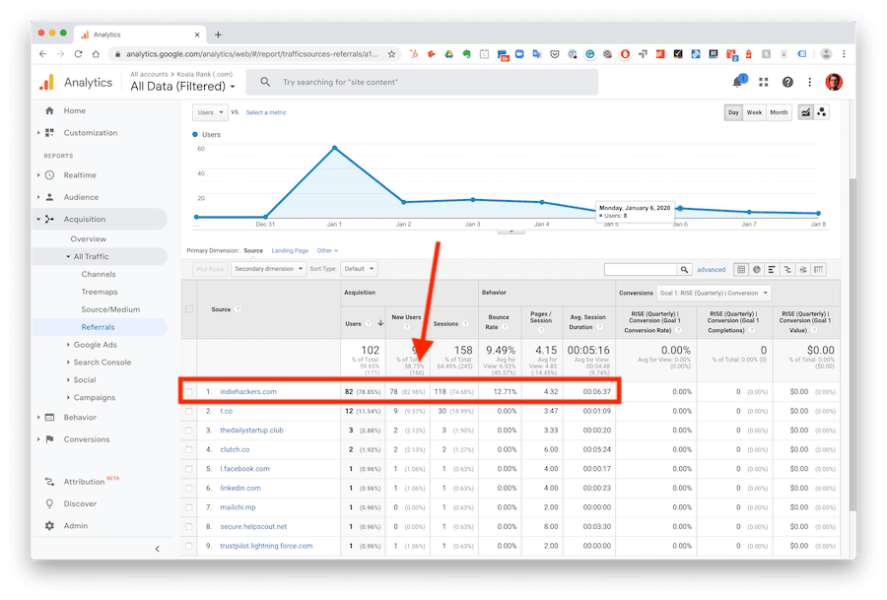
So, if we exercise a bit of that GA magic, we can see exactly which country those 82 users are from, what device they use (both category and brand), age and affinity category (only if you’re connected with a Google Ads account), and more.
Now we know that most users coming through Indie Hackers are from the US, but we can also see a few coming from the UK, Germany, India… This kind of filtering can be applied to any of your referrals and it helps you understand which channels are best for your business.
More reading on Google Analytics acquisition reports:
- How to Use Google Analytics Acquisition Reports to Know Where People Are Coming From
- Exploring Google Analytics Acquisition reports and data
User Behavior
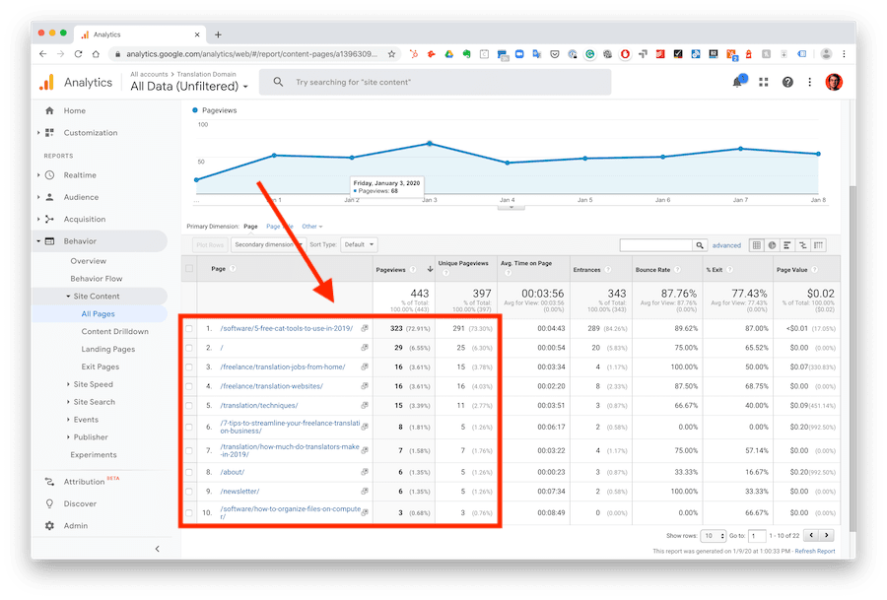
As a content marketer, the behavior report is where I spend most of my time, especially because of the “Site Content” sub-report which helps with analyzing the performance of blog posts (or any page on your website, including landing pages).
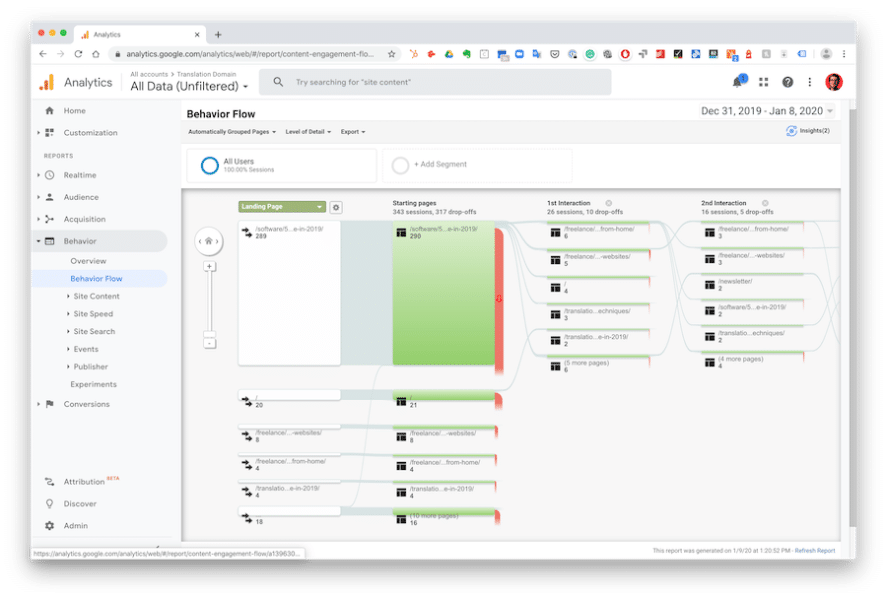
The behavior report is fairly straightforward and it offers a few neat tricks that might be useful to you; things like behavior flow and content drilldown for example. Since these two sub-reports are so interesting, I’ll leave the word to the experts:
“Behavior flow visualizes the path a user follows from one page to the next or from one event to another. A path can be multiple pageviews or just a single pageview during a session. Wouldn’t you want to know what brought a user to your turf, what sections of the website caught the user’s attention and at which point did the user exit? This report lets you know just that.”Source: Marketlytics (Link to quote in the resources below)
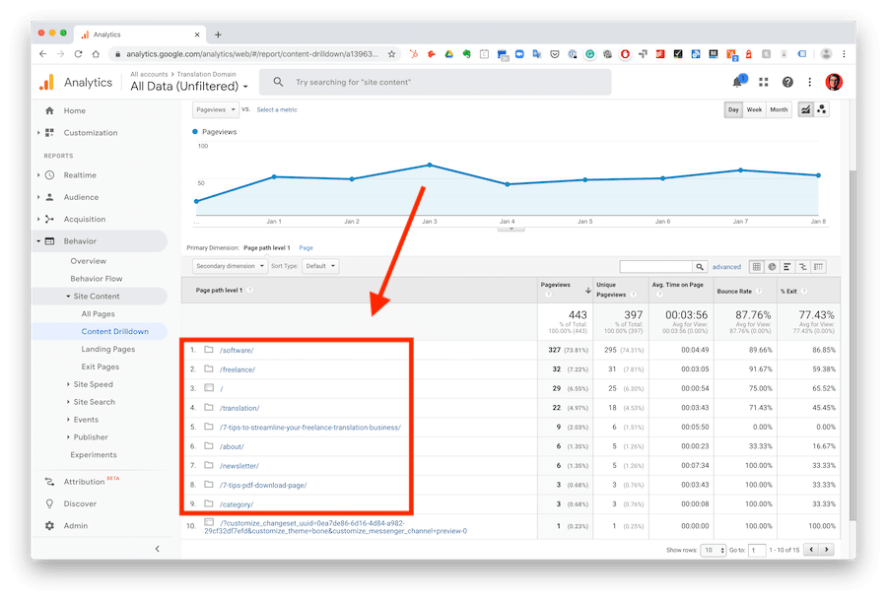
“The content drilldown section within Google Analytics shows the taxonomy of your site, what the organization looks like, and where people interact on your site. Within this report, you can see how many page views a URL gets, the bounce rate, the exit rate, and the time spent on the page.”Source: TM BLAST from Greg Kristan (Link to quote in the resources below)
Between all the metrics available in the behavior reports, I find landing and exit pages to be very useful. With these, you can immediately tell where your users are dropping off and, with a little bit of magic provided by third-party tool Hotjar, you can work on improving your user experience so that people stay on your website longer and consume even more content.
More reading on Google Analytics behavior reports:
Conversion Tracking
Google Analytics allows you to set your own conversion goals and assign a monetary value to them so that you can keep track of user behavior that positively impacts your business.
In theory, this is a great thing. Talk to any digital marketing expert and they’ll tell you that setting up analytics goals with your business in mind is paramount. In practice though, goals are a mess to set up, and they’re just plain confusing.
Time and time again, I see business owners being puzzled by this feature. I personally don’t like it either (even though I’m still trying to figure it out). But don’t take the word from me. Analytics expert Charles Farina has a great post talking about why GA goals are a broken concept.
I won’t go into detail on how to set up goals. There are plenty of tutorials on this that I will happily share with you in the resources down below. Whether you should use them or not is up to you; I recommend giving them a try if you have somebody skilled at analytics in your team.
More reading on Google Analytics goals and conversion tracking:
- 4 Google Analytics Goal Types That Are Critical To Your Business
- How to Create a Goal in Google Analytics to Track Conversions
Custom Reporting
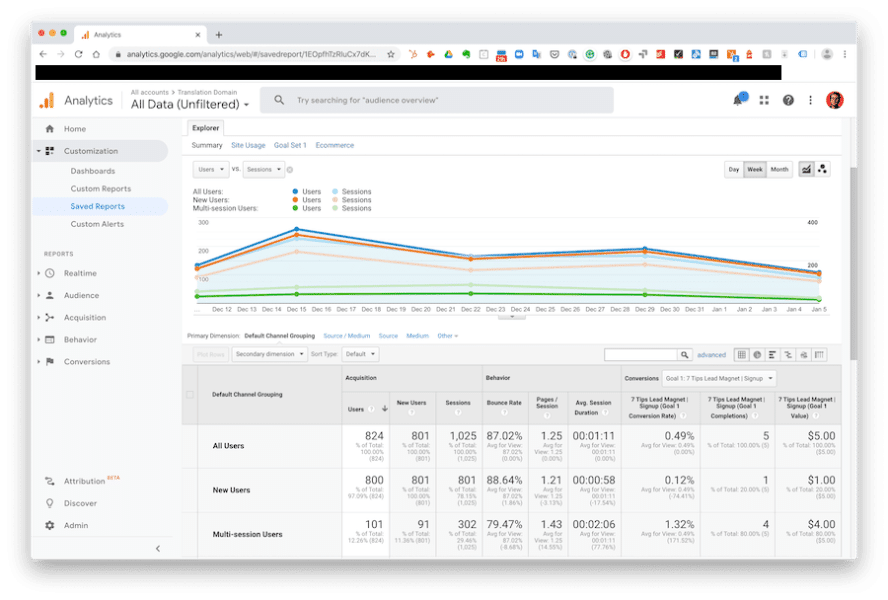
This is where a lot of the fun happens. With Google Analytics, you can do any kind of custom reporting: personalized dashboards, custom and saved reports, custom alerts, etc. You can play around with these options from the “Customization” tab in your GA interface.
Very briefly, let’s go through each one:
- Custom dashboards display your Google Analytics data in a unique, personalized way. You can create them for yourself or even import one from Google Analytics’ user-powered solutions gallery.
- Custom reports are customizable snippets of data that you can create from your “Customization” menu for specific purposes.
- Saved reports are a simple way to reference reports you previously worked on that you don’t want to lose. This is useful when you apply advanced filters or metric comparisons that you might not remember down the road.
- Custom alerts are fired when a set of pre-configured conditions are true. This is useful for things like troubleshooting or milestone tracking.
This is just the tip of the iceberg when it comes to customization in GA. Advanced users can also create and manage all kinds of custom variables within the Google Analytics interface.
Side note: Custom dashboards and custom reports are being deprioritized as Google is moving more and more towards using Data Studio as its de-facto tool for data visualization. It might be worth checking out if you need this kind of visualization.
More reading on Google Analytics custom reporting:
- How to Create Custom Reports in Google Analytics
- 12 Google Analytics Custom Reports To Help You Grow Faster
Advanced Integrations
By using Google Tag Manager (GTM), you can create custom variables that feed into your GA data directly when specific events happen on your website. Things like button clicks can fire a tag from your website that feeds into your custom variable to show data relevant exclusively to your business. This is an advanced concept. You can learn more about it in the resources below.
Google Analytics also allows you to connect to any third-party tool through their public API (as long as the feature is supported). For example, if you use WordPress as your CMS, you can get analytics data directly within your dashboard for easy consumption. At Koala Rank, we recommend focusing on the standard GA interface, but the option is there in case you need it.
More reading on GTM variables and GA integrations:
- User-defined Variable Types For Web
- 20 Must-Have Google Analytics Integrations That Marketers Rely On
Google Search Console
Google Search Console (formerly known as Google Webmaster Tools) was first launched in May 2015, but it was revamped in January 2018. Many experts say it was heavily dumbed down after the switch and, to be quite honest, I also find the interface to be jarring at times.
For example, you can’t open reports in new tabs…
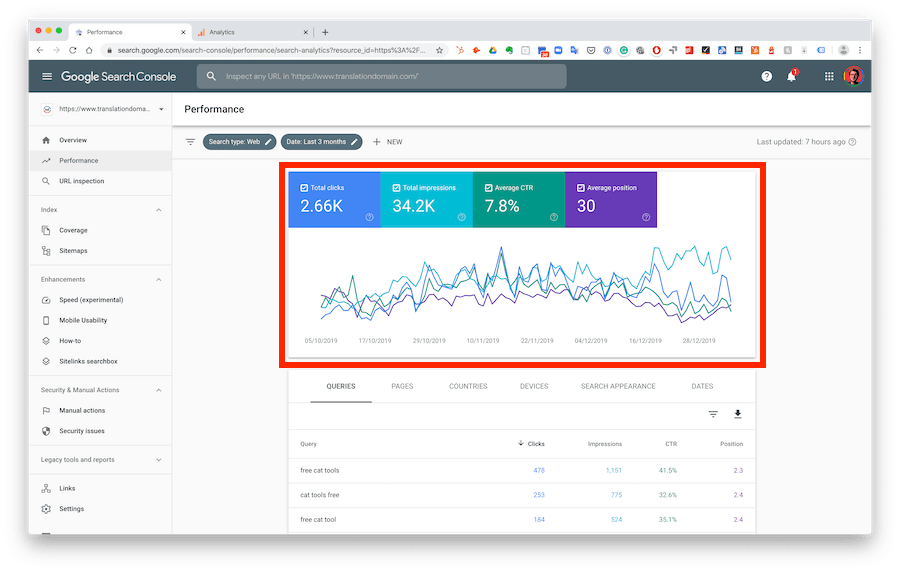
But let’s not get ahead of ourselves. GSC is an extremely powerful tool that shows you all the relevant search data from Google themselves. This means you get to see how many times your search snippet was rendered on someone’s screen (impressions) and how many times it was clicked.
And what can we squeeze out of these two metrics?
(Clicks/Impressions) * 100 = Click-Through-Rate (CTR)!
This is one of the most important metrics that GSC provides you with as it allows you to optimize against your competitors and win precious clicks that drive quality traffic to your site.
Finally, GSC also shows you your average rankings based on specific queries that users type in or pages on your website.
The crazy thing about Google Search Console is that the interface changes based on the features implemented on your website and how visible it is on the Search Engine Result Pages (SERPs) compared to other websites.
Look at these two menus side by side:

The first one shows a single “Performance” tab while the second one offers multiple options such as “Search Results” and “Discover”.
The latter gets added if your site receives traffic from Google’s Discover feature. The same goes with things like Schema markup.
Interesting, right? Your GSC interface evolves together with your website, and it shows you relevant information from Google themselves regarding their own products and ideal optimizations. So, let’s dive deeper into each element of Google Search Console to learn more about it!
Organic Search Data
We’ve briefly touched on organic search data in the screenshot above, but we can continue by narrowing down into advanced filters and date ranges.
As previously mentioned, the core metrics in GSC are:
- Search impressions
- Clicks on your search snippets
- Your Click-Through-Rate (CTR)
- The average ranking of your pages
But let’s dive deeper. With GSC, you get a whole lot more than that. For example, did you know that you can see all search queries your users typed in before landing onto your blog post? Or that you can sort and gauge the performance of your pages by date, country, specific page?
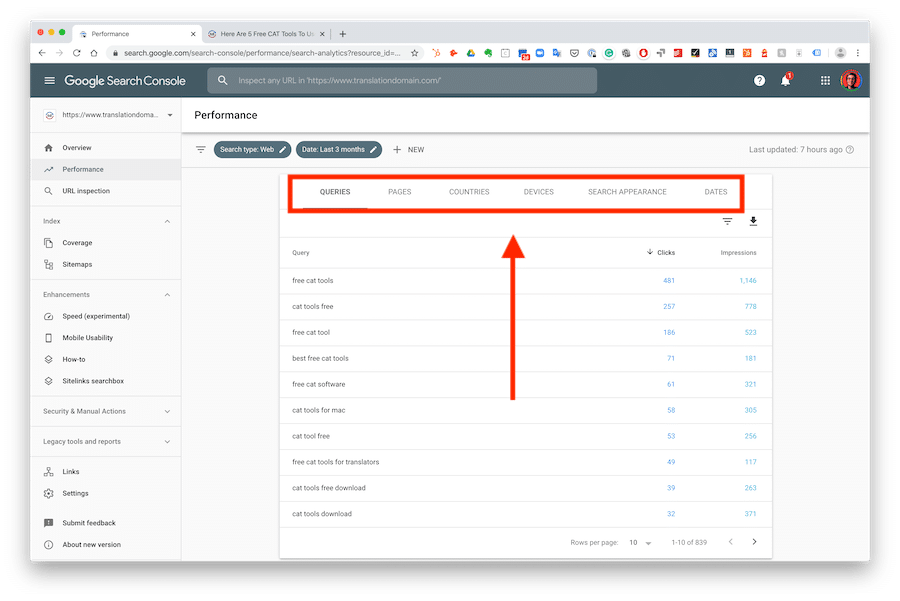
This data is immeasurably valuable.
For each category, you can toggle the four key metrics we talked about on or off to focus on what matters to you, and even filter things out in case they are not relevant to your research.
You can do this with the filter bar at the top of your screen, and the metrics are toggled when you click on their respective blocks:
Overall, GSC is the ultimate SEO tool. Here you can learn anything and everything about your website performance on Google.
Similar tools are available for other search engines such as Bing and Yandex (the latter of which is a gateway for ranking on DuckDuckGo).
More reading on Google Search Console basics:
URL Inspection & Live Tests
The URL inspection tool on Google Search Console is one of the most useful parts of the entire suite. It allows you to enter any URL from your site and analyze its content from a technical standpoint.
Remember that Google has quality guidelines you have to follow in order to rank on their search engine. This tool helps you see what Google thinks of your pages and it even gives you suggestions based on their data.
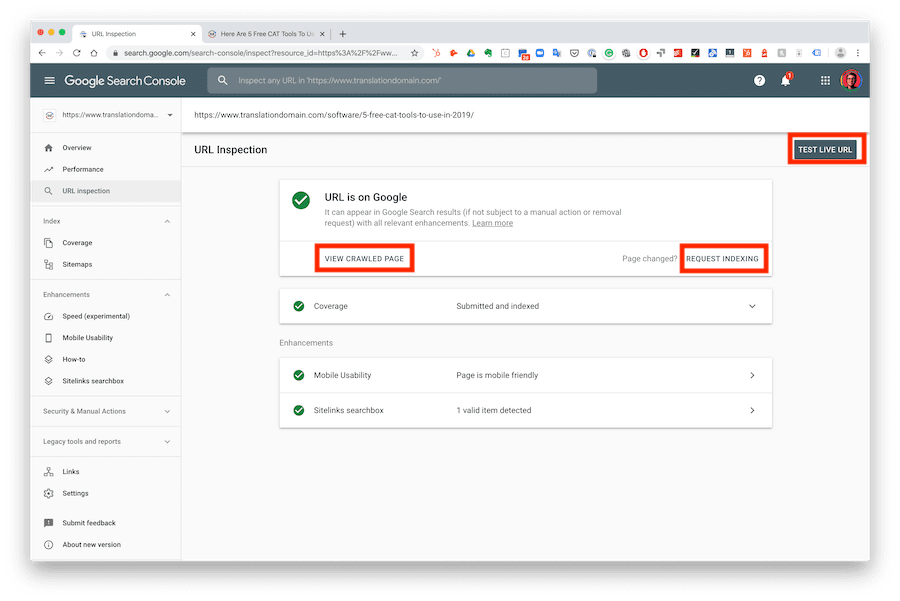
Some of the features offered by the URL Inspector are:
- Request Indexing (Formerly known as Fetch as Google)
- View Crawled Page
- Test Live URL
- Coverage
- Mobile Usability
- Sitelinks Searchbox
Maria Johnsen has a great post explaining how the URL inspector works, and how it can benefit your SEO. I personally find that all the features listed above are crucial to the effectiveness of your SEO strategy (except searchbox).
For example, when you first publish a new blog post, or you modify a page, you want Google to recognize the changes as fast as possible. The “Request Indexing” feature is very helpful in that realm and works much faster than you’d think.
Side note: Indexing does not mean ranking! Your page could be shown as “URL is on Google” but its ranking could be very poor. The green checkmark is not an indicator of content quality but rather a signal that Google thinks your page is ok from a technical standpoint.
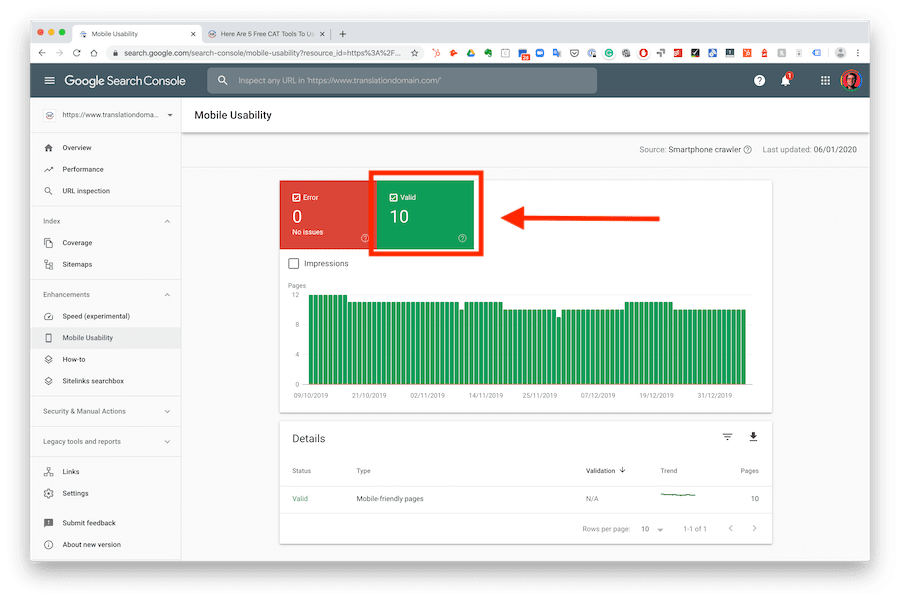
Website Enhancement (Speed, Usability & Schema)
The speed report is a relatively new part of Google Search Console and doesn’t guarantee 100% accurate results, but it is a good metric to look at if you’re wondering what Google thinks of your website speed-wise (in case you didn’t know, speed is huge in SEO!). You can find this data elsewhere sot this is not an essential part of the GSC experience.
However, you should always keep an eye on the mobile usability report and—in case you use schema markup—the “How-to” or “FAQ” sections that are going to pop up automatically. You want these to be checked out for your markup to show up successfully on SERPs.
Don’t underestimate technical issues! SEO is equal parts content, links, and technical prowess. If you’re serious about growing your business with SEO, don’t skimp on the technical side.
More reading on Google Search Console enhancements:
- A Guide To Using Google’s New Speed Report Effectively
- Google Search Console and the Structured Data Enhancements Report
Inbound & Outbound Links
Want to know who linked back to your website? Google tells you that. There are two key features that I love about the links report:
- Export External Links
- External Links » Top Linked Pages
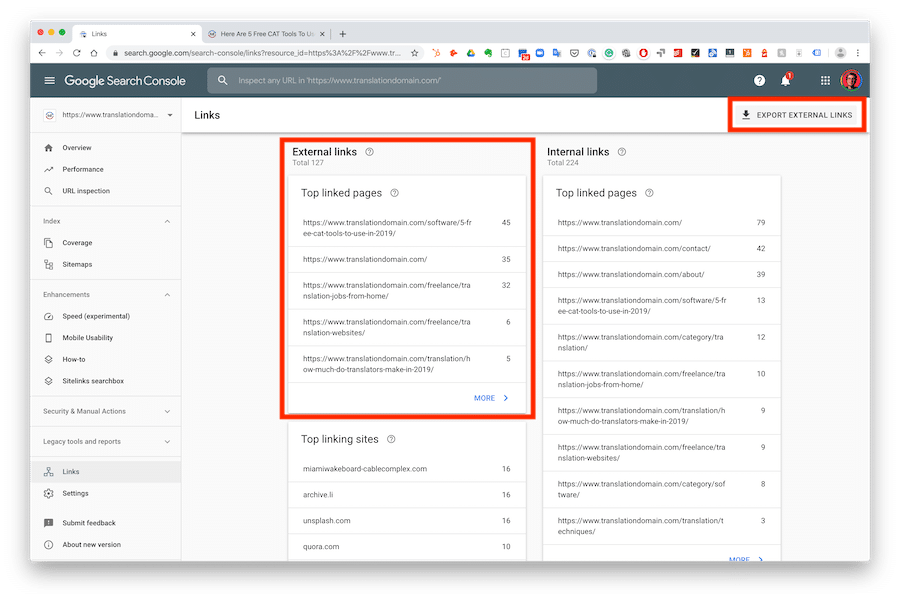
With this report, you can see data regarding other websites, bloggers, and influencers linking back to you. You’d be surprised by how many links you can gather over time (most are trash, but some are great to grow relationships).
Use the report to highlight high-quality sources and contact them directly to enhance your relationship with them. Use it also to gauge the popularity of your page and how you can repurpose your content to maximize its reach.
More reading on the Google Search Console links feature:
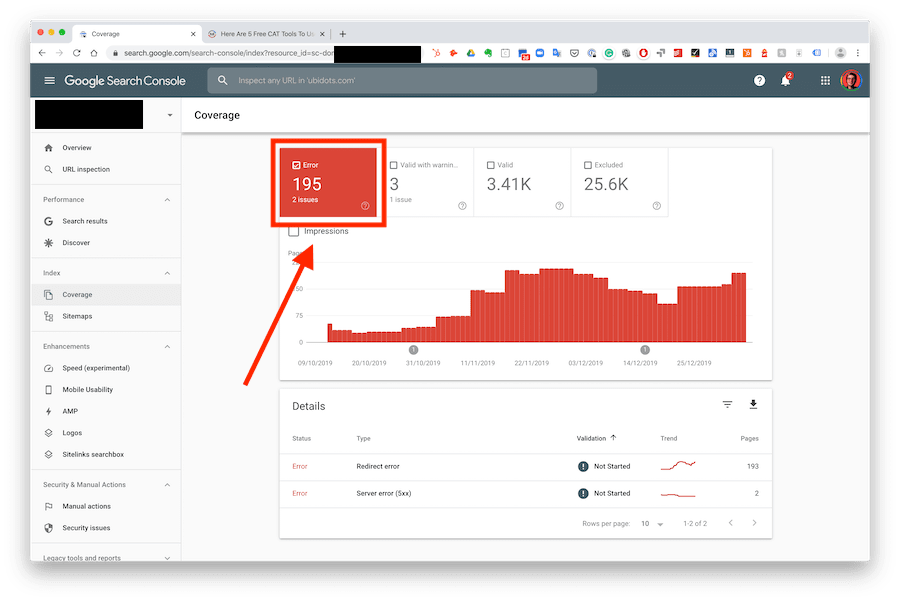
Crawl & HTML Errors
This type of error is presented to you when Google’s spider crawls your website and finds issues that either prevent it from indexing the page or go against Google’s guidelines.
There are a million reasons why you could be presented with one of these errors, and you shouldn’t panic in case you see too many red bars on your “Coverage” tab. Instead, keep an eye on it and go through the errors one by one.
Ideally, you want your website to hit zero errors.
When you start releasing a lot of content for your website, it’s normal to forget about a small detail, or enter a bug in some custom HTML code. Google Search Console tells you about these problems so that you can act on them.
At Koala Rank, we recommend checking this tab on a weekly basis and fixing the issues as they come. For big websites, you can also create a sheet and prioritize the fixes depending on how important the pages are.
Side note: Leaving too many errors unattended will impact your SEO in the long-term, so don’t ignore this. Allocate some time each week to maintaining the security, speed, and overall structure of your website. Nobody likes a broken site experience!
More reading on Google Search Console crawl and HTML errors:
Malware Detection
Google Search Console features a neat “Security Issues” tab that shows you all the problems your site or application may be facing. Sometimes, these security issues can become really scary and highlight loopholes in your website’s security.
GSC malware detection is a topic that spans a lot of fields, including troubleshooting, securing your web server, and other technical domains. Matt Southern from Search Engine Journal has a great roundup on this that will help you understand the topic better than I could explain.
Connecting Search Console to Google Analytics
It’s possible to connect GSC to GA so that all relevant data is integrated in one interface. You can do this in six simple steps by following Google’s simple tutorial. Once you successfully connected both your accounts, you should see this under your “Acquisition” tab:
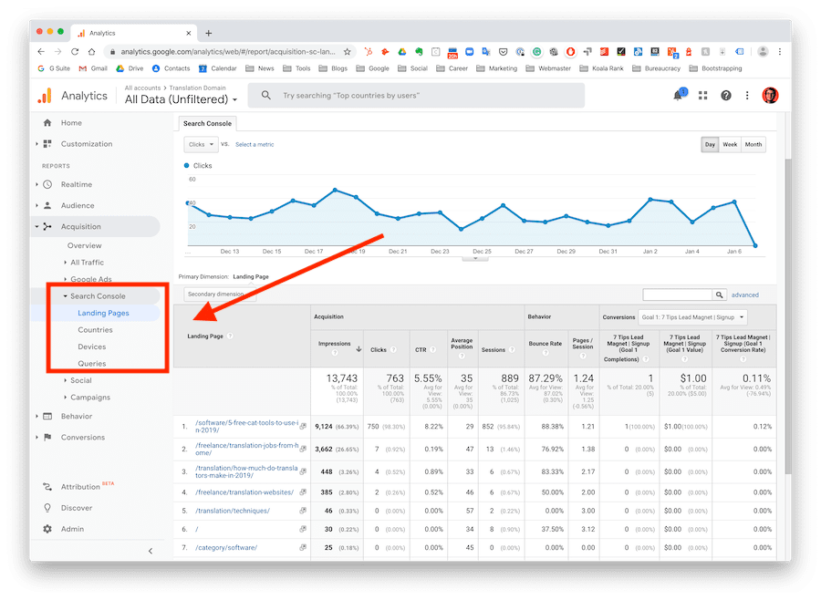
Gathering all your Google data in one spot has obvious benefits. At Koala Rank, we recommend you link them together as soon as possible.
Google Analytics vs Search Console: the verdict
You can’t really compare Google Analytics and Google Search Console one-to-one. They used to have things in common (queries were once shown in Analytics by default), but now they’re two completely different tools serving specific data on: 1) user behavior and; 2) search performance.
For example, a new business could build an incredible referral traffic strategy to gain traction on the market and still get no performance data coming in through GSC other than the inbound links they’ve created to get people onto their website.
On the other hand, GA would present them with a slew of options to sort demographics, location and behavior data.
Which one should you use? Both.
In an ever-changing marketing landscape, organic search traffic is one of the few ways to achieve continuous growth, so GSC cannot (and should not) be skipped.
At the same time, targeted referral traffic can be of higher value, giving you the opportunity to lead people back onto a landing page and measure the results of your campaign via goal conversions.
So, which one will you jump into first?
I hope this post helped you fully understand the difference between Google Analytics and Google Search Console.
Don’t forget to share it with colleagues and friends and feel free to browse our blog for more content on using analytics to build your online audience!
Originally published Jan 10, 2020
Frequently Asked Questions
Google Analytics was made with behavior tracking in mind, providing insights on how users interact with your website or app. Google Search Console was built with Google Search in mind, offering site owners data regarding online visibility, organic reach, and technical optimization.
Google Search Console is a tool that helps you analyze SEO data related to your website and Google’s search engine. Here, Google provides you with metrics such as impressions, clicks, click-through-rate (CTR), and average rankings for your website content.
Connecting GSC to GA is fairly straightforward. In GA, go to your Admin area, click on “Property Settings”, scroll down to the “Search Console” section, click on “Adjust Search Console” and link your GSC property directly within the GA interface. Done!